Commission Dashboard
Dashboard to assign performance-based commissions for medical staffs in clinic
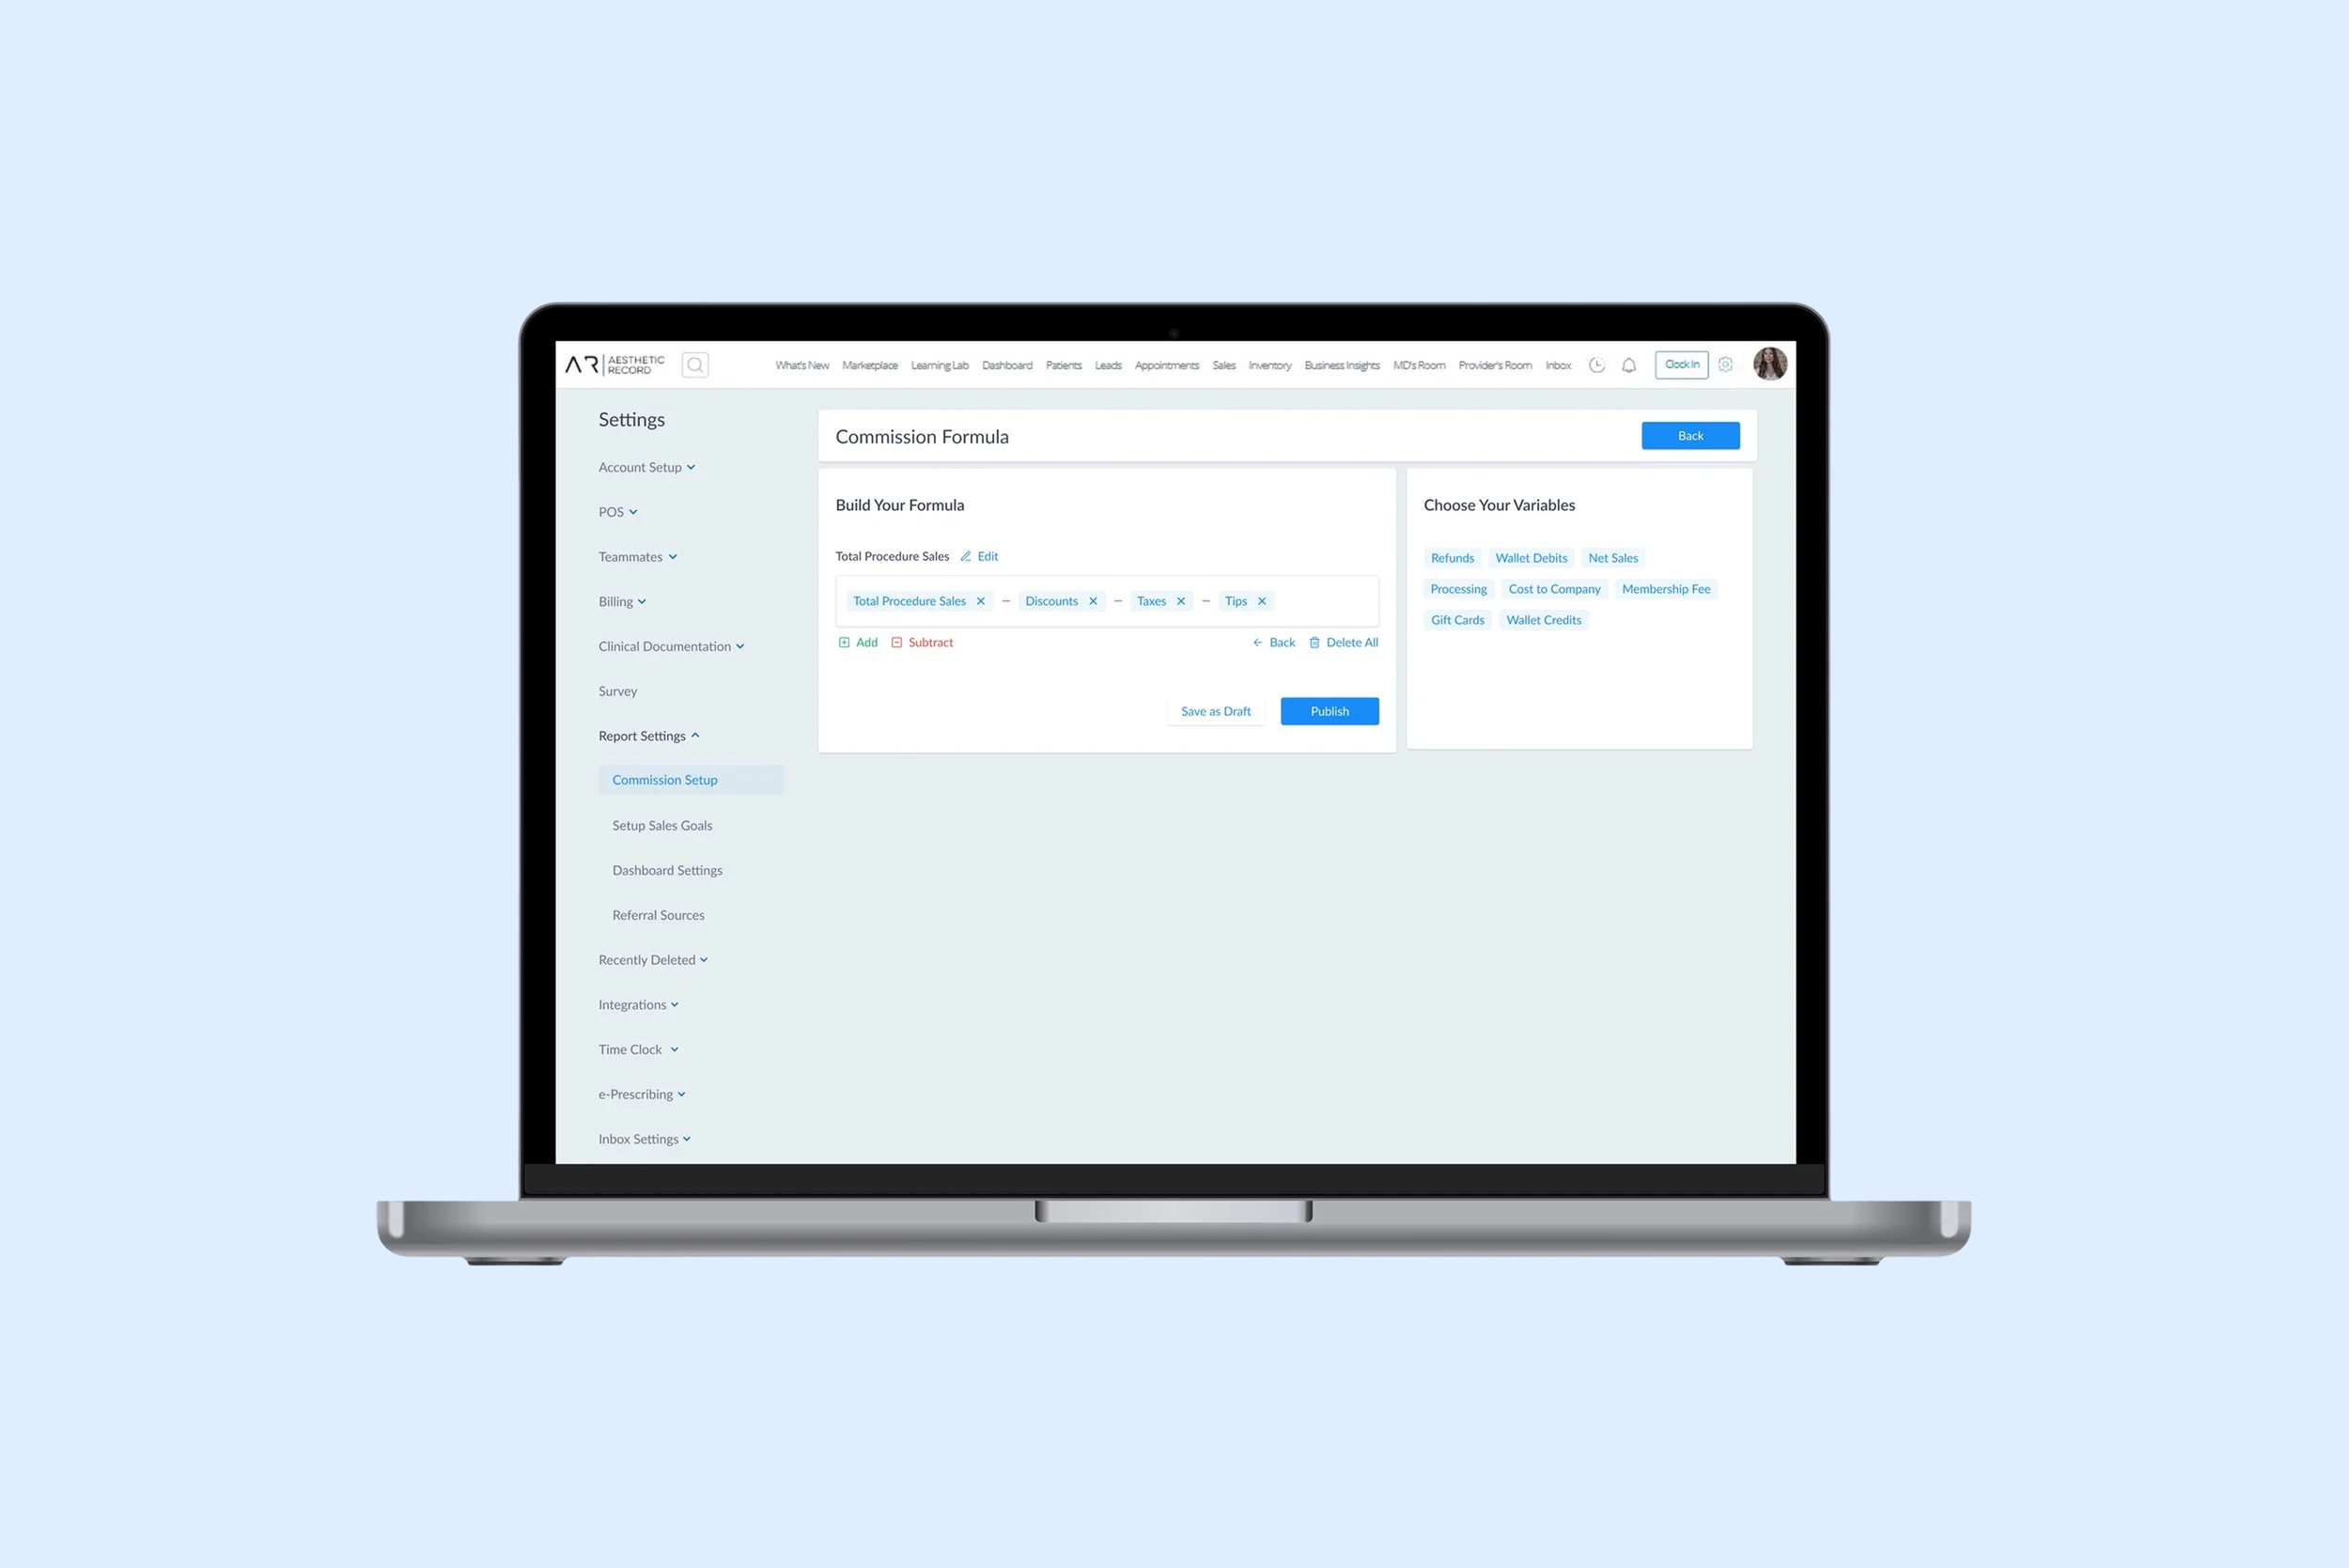
Role: Lead Product Designer I Team: 1 Designer, 1 PM, and 1 Developer I Timeline: 4 Weeks
CONTEXT
Overview
Aesthetic Record is a HIPAA-compliant Electronic Medical Records (EMR) platform designed for Medical Spas, Dermatology, Plastic Surgery, and Wellness Clinics. Within a fast-paced design sprint, I led the UX efforts for redesigning the Commission Reporting experience, focusing on information architecture, wireframes, visual design, and interactive prototypes. The goal was to improve clarity, flexibility, and usability for managers who rely on commission data to make informed decisions.
Problem
Managers use Aesthetic Record’s internal web platform to track staff performance and assign commission payments. However, the existing commission reporting experience made it difficult to:
Customize commissions into meaningful categories
Assign commissions accurately to individual staff members
Quickly understand who is earning what and why
These limitations increased cognitive load, slowed workflows, and made it harder for managers to confidently track performance and reward staff fairly.
Solution
The redesigned Commission Report Page focused on improving usability and control by:
Enabling flexible customization of commission categories
Allowing managers to easily assign different commission types to specific staff members
Streamlining the overall workflow to reduce friction and improve efficiency when managing commission-based compensation
The design prioritized clarity, scalability, and ease of use to support real-world operational needs
🎉 Outcomes
We received a survey satisfaction rating of the final product from 27 clinics, resulting in a rating of 4.6 out of 5.
RESEARCH
Define the Goal
In our meeting, the Product Manager (CGO) and I organized a meeting with several clinic managers to uncover their frustration with the current payroll/commission report.
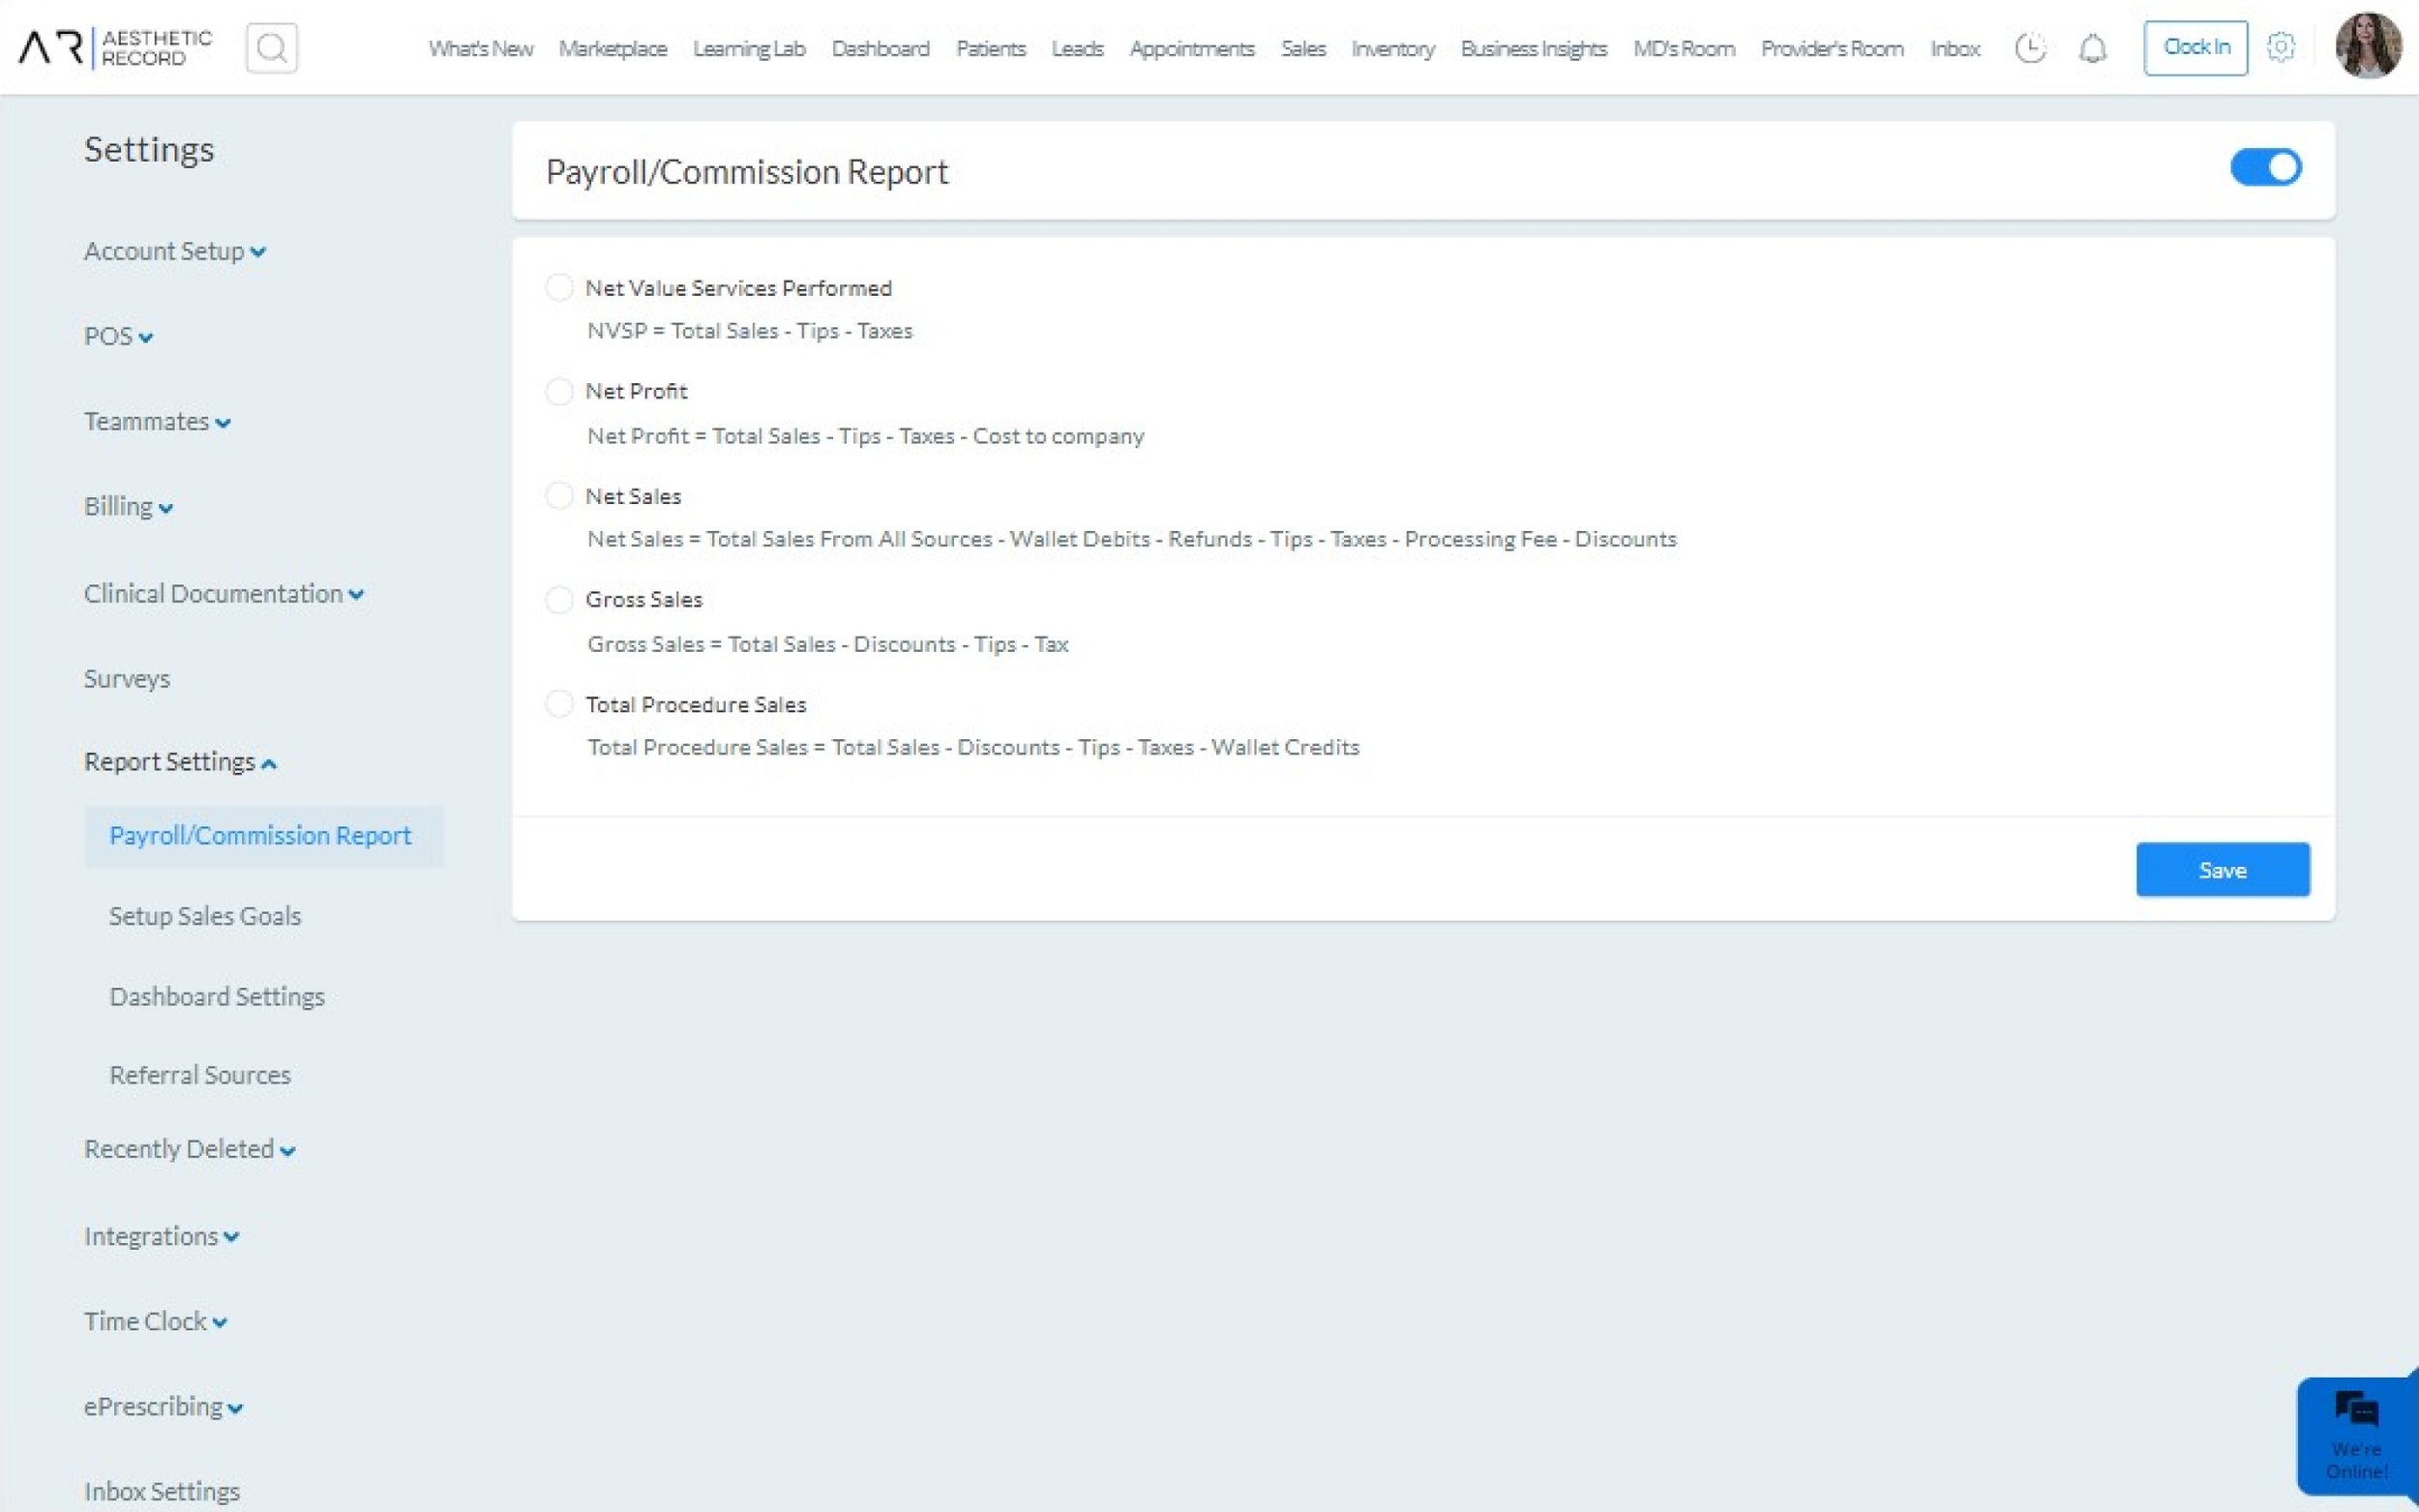
Our primary objectives were to identify user needs, analyze the old reporting page, and create a new feature list, with a specific focus on enhancing customization.
This is what the previous product looked like:
User Research
Although the design sprint timeline was short, I prioritized gaining direct insight into the clinic managers’ experience. To quickly build empathy and validate pain points, I conducted two light-weight but impactful research methods.
1. User Shadowing
I remotely observed 10 clinic managers as they navigated the existing commission reporting page. Watching users complete real tasks in real time revealed usability issues, workarounds, and points of friction that were not immediately obvious from the UI alone.
2. Interviews
Following each shadowing session, I conducted short interviews to better understand managers’:
Preferences and expectations
Motivations when managing commissions
Pain points and suggestions for improvement
This combination of observation and direct feedback helped clarify both what was broken and why it mattered.
Key User Pain Points
Synthesizing insights from the research revealed several recurring pain points that informed the design direction. These findings led to a clear problem statement and a focused How Might We question.
Limited commission categories prevented managers from aligning incentives with real sales and service performance
No centralized view of staff earning commissions led to manual, error‑prone tracking
Inflexible assignment rules made it difficult to apply commissions to individuals or groups
How Might We
How might we improve the customization of commission reporting for clinics, enabling efficient tracking and management of commissions across individual and grouped staff members?
To address this question, the design focused on:
Creating a flexible and customizable commission reporting system based on staff performance
Providing a clear, accessible view of all staff receiving commissions
Enabling easy assignment of different commission types to individuals or groups
IDEATION
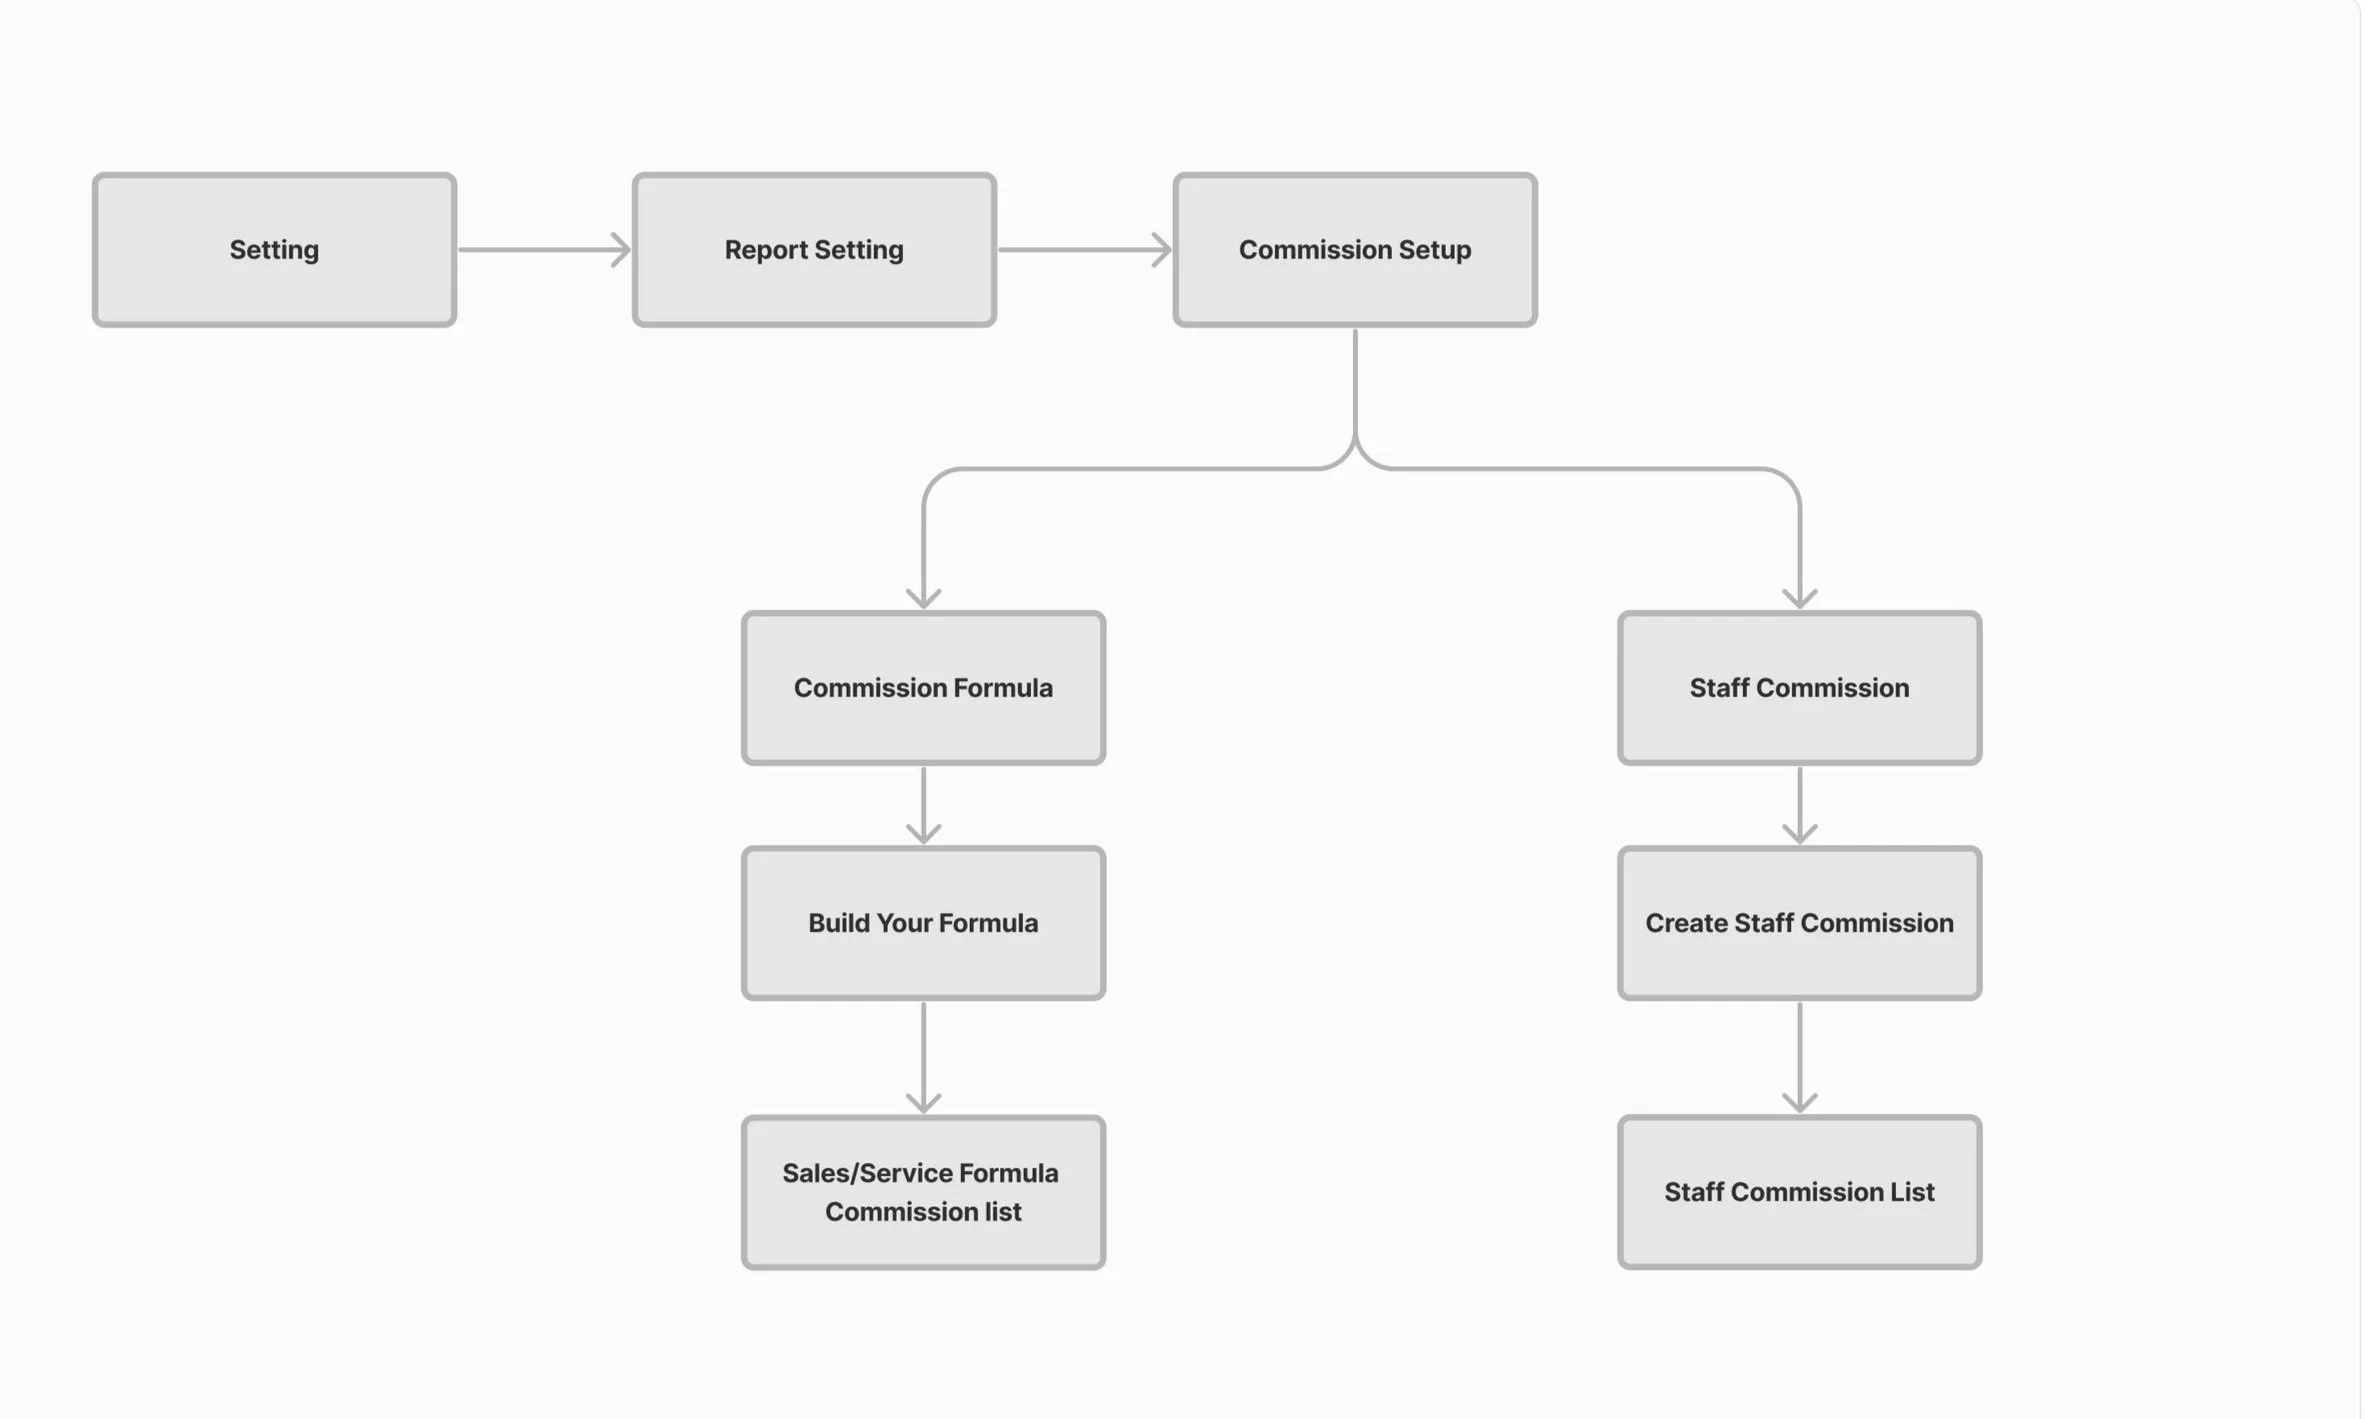
Site Map
Based on user insights, the product manager and I restructured commission reporting into a two-part dashboard that separates high-level insights from detailed commission management.
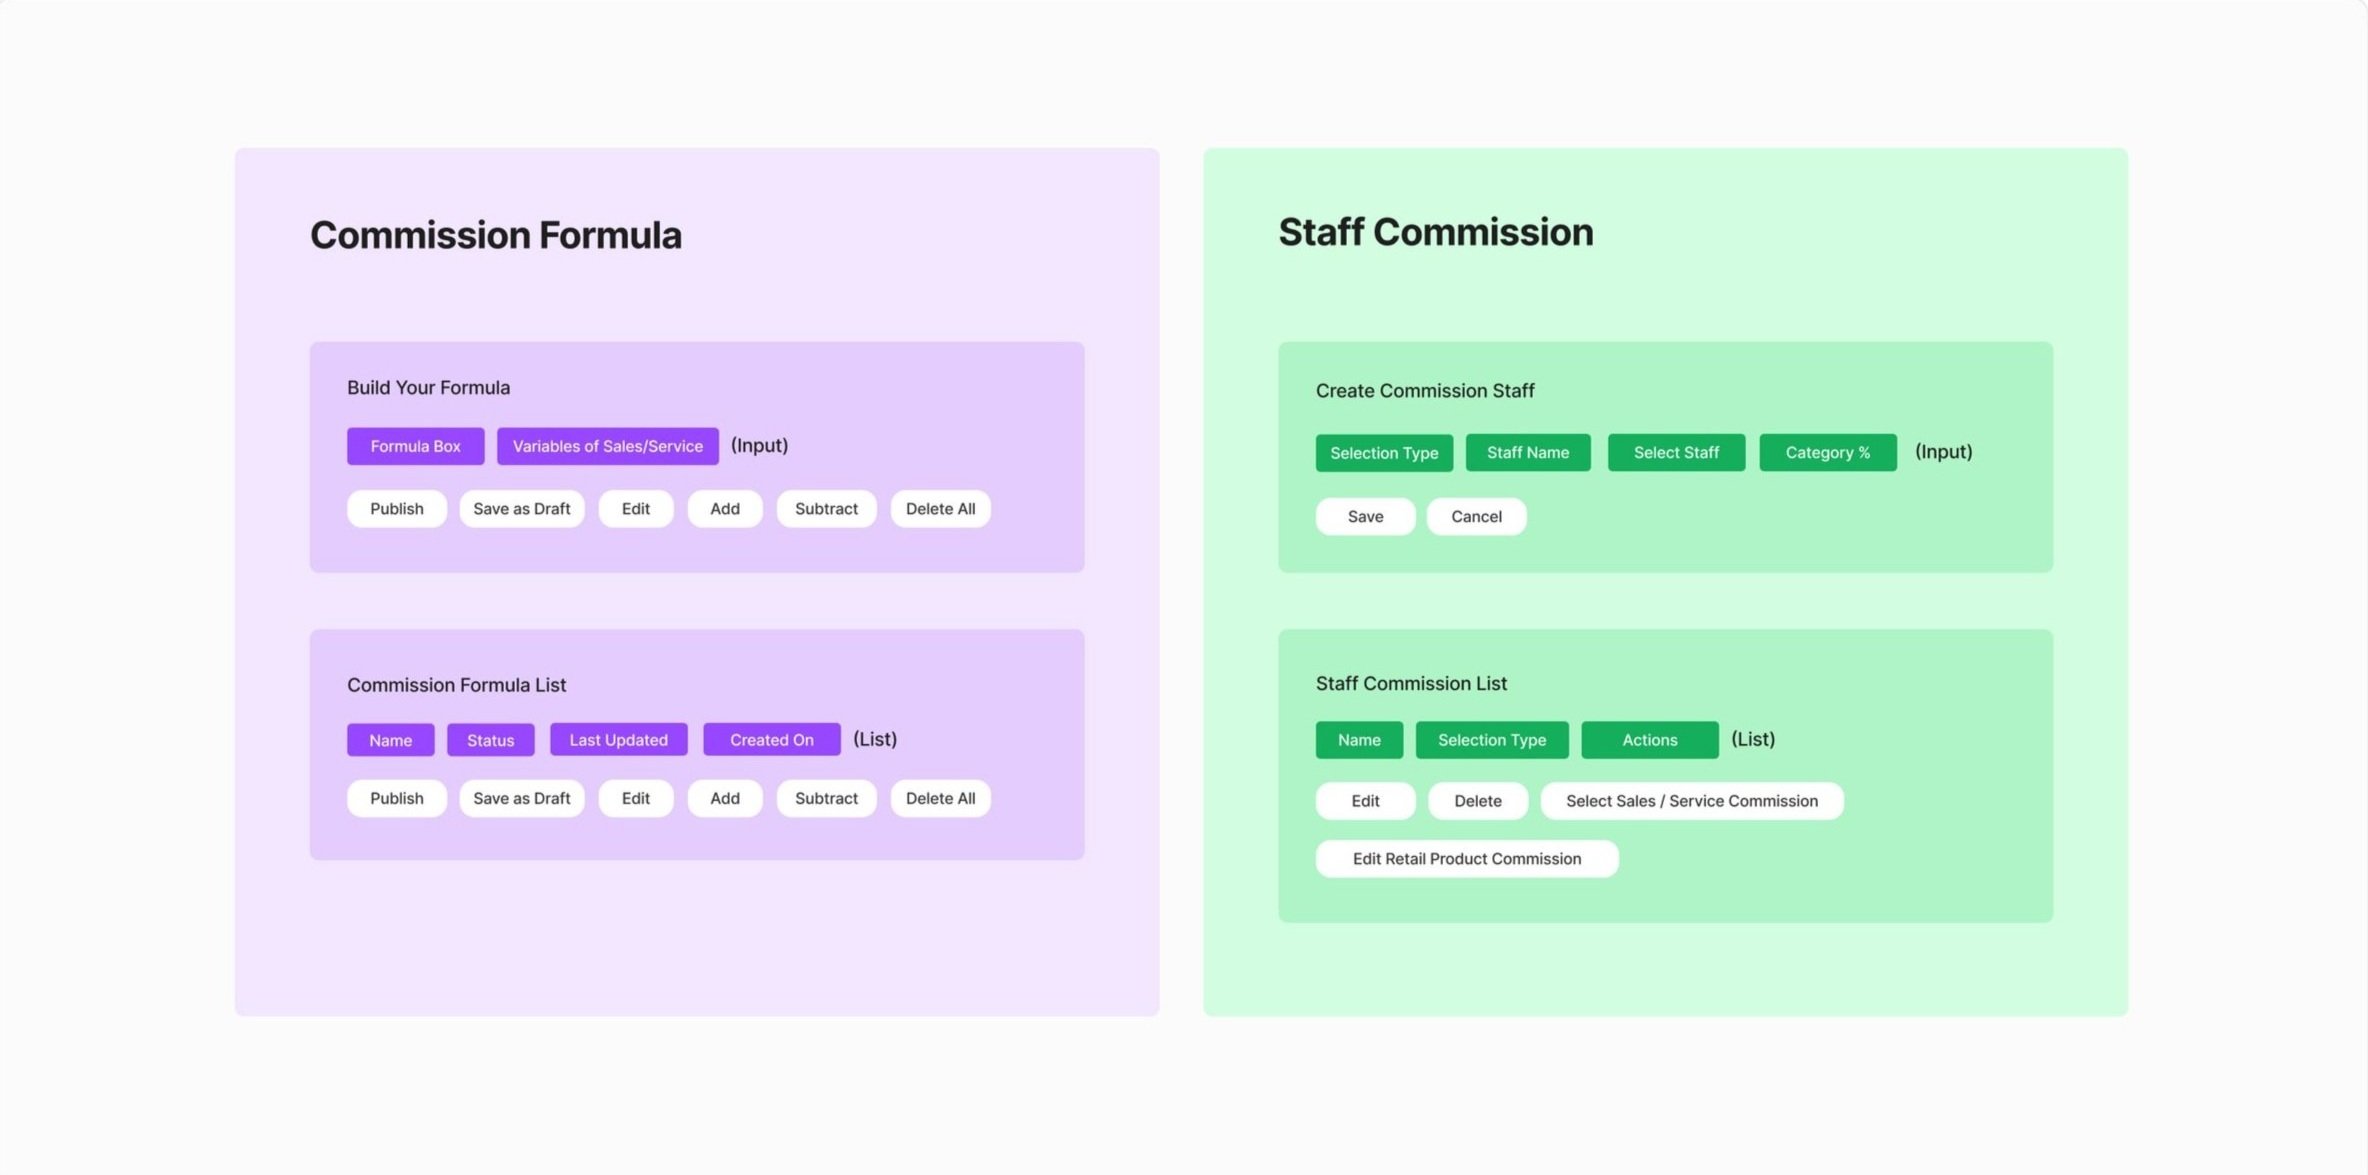
Feature Action Grouping
After defining the site map, we outlined detailed dashboard features and grouped them by the key actions users take on the commission formula and staff commission pages.
DESIGN
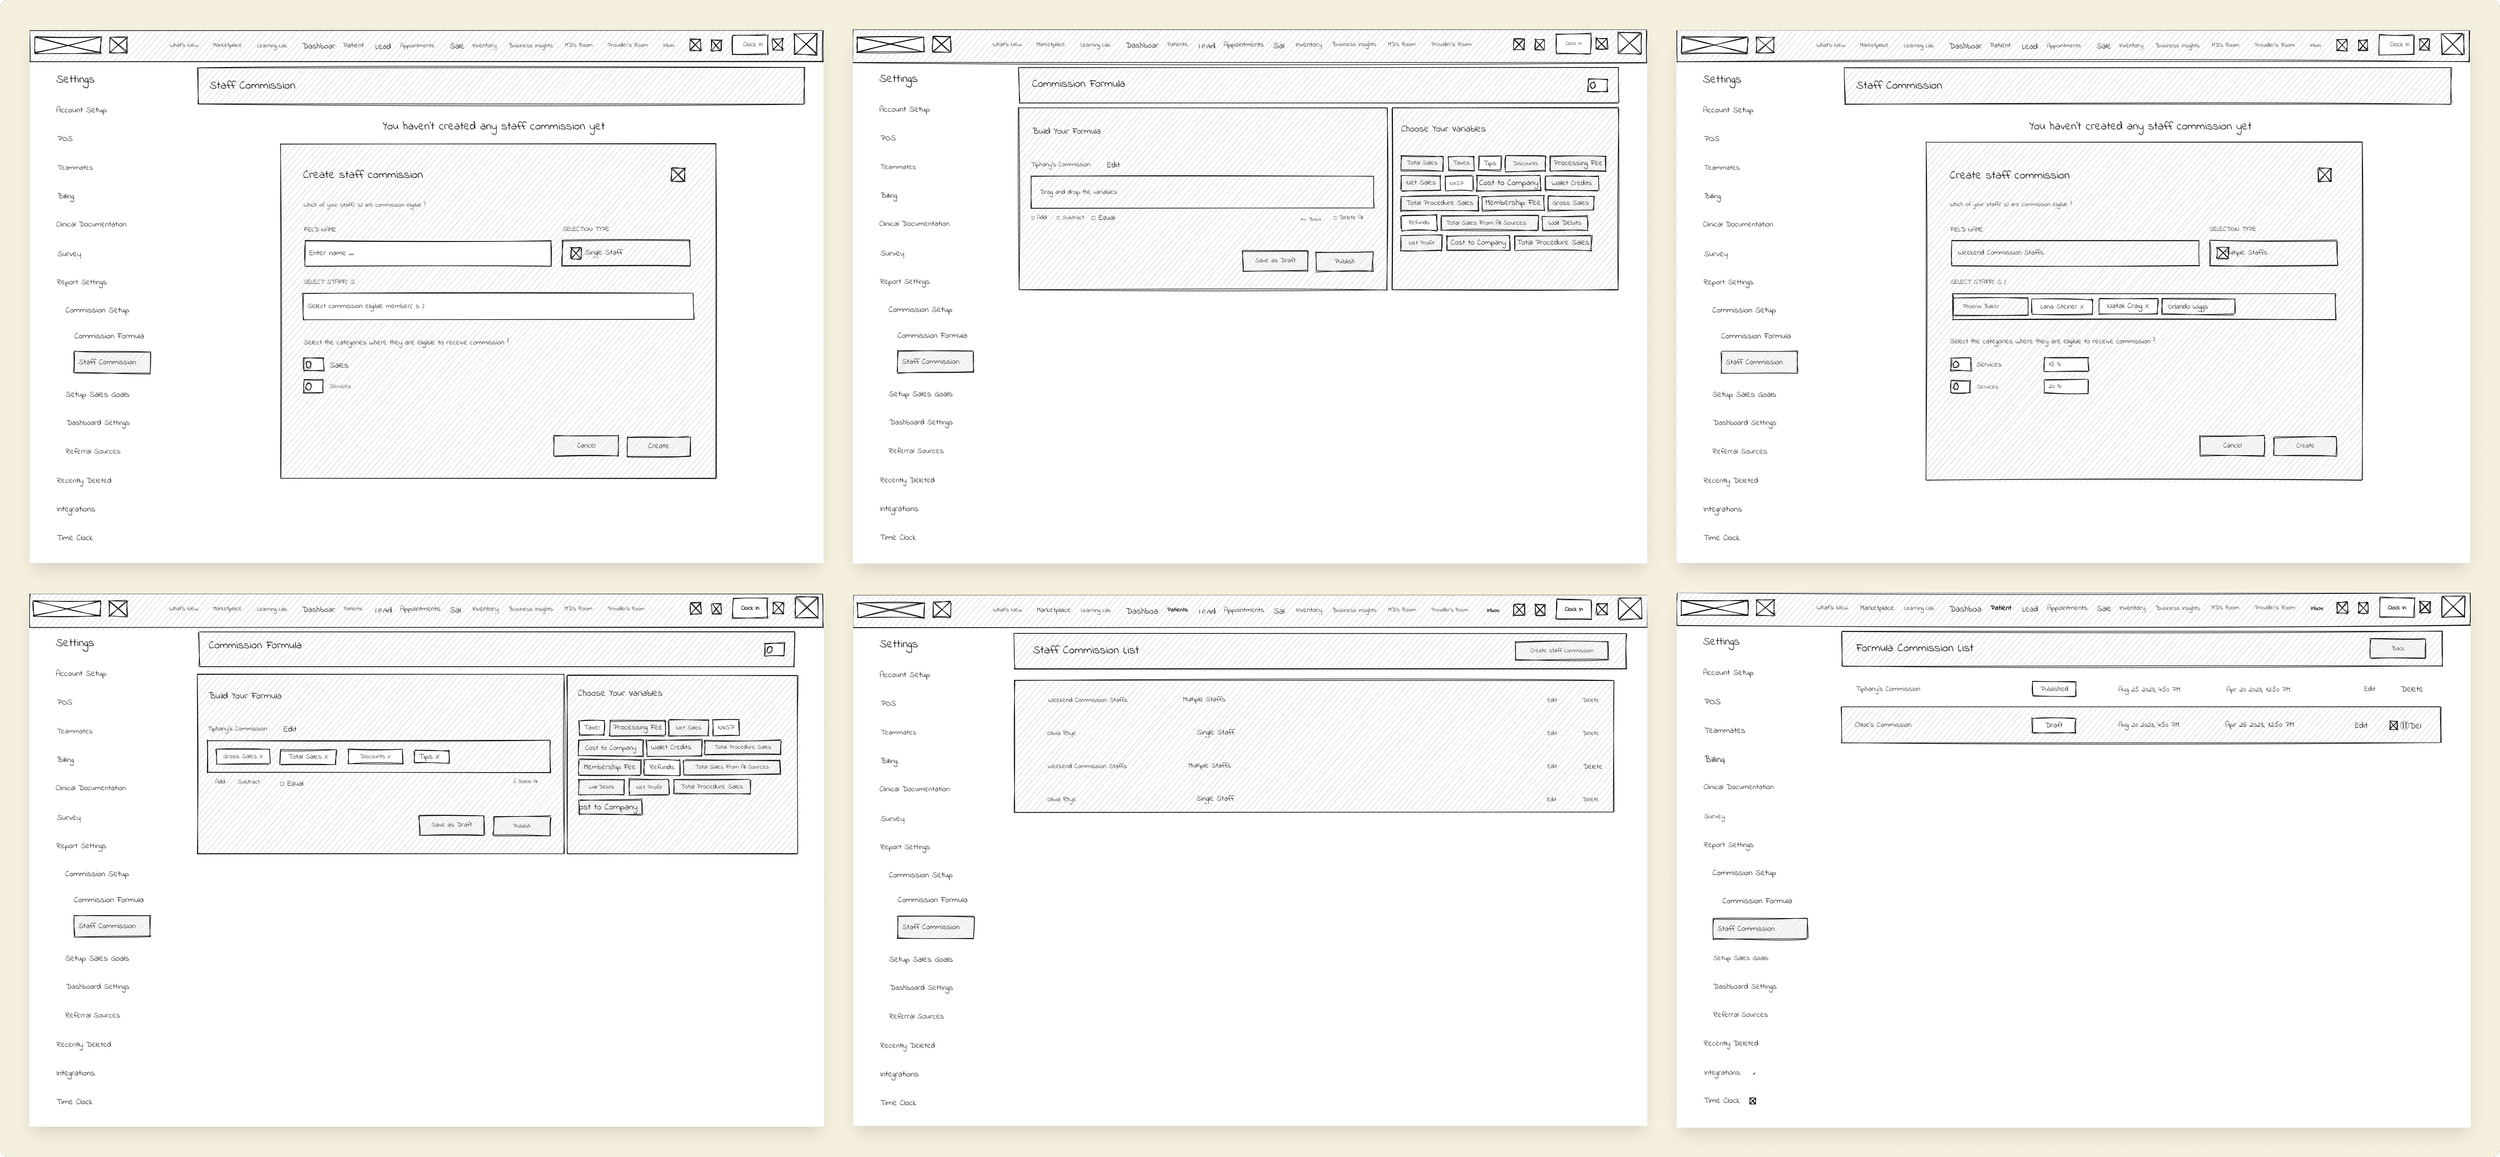
Wireframe
Using the sitemap and action‑grouped features, I designed page‑level wireframes and presented them to the team to validate success criteria and refine the experience.
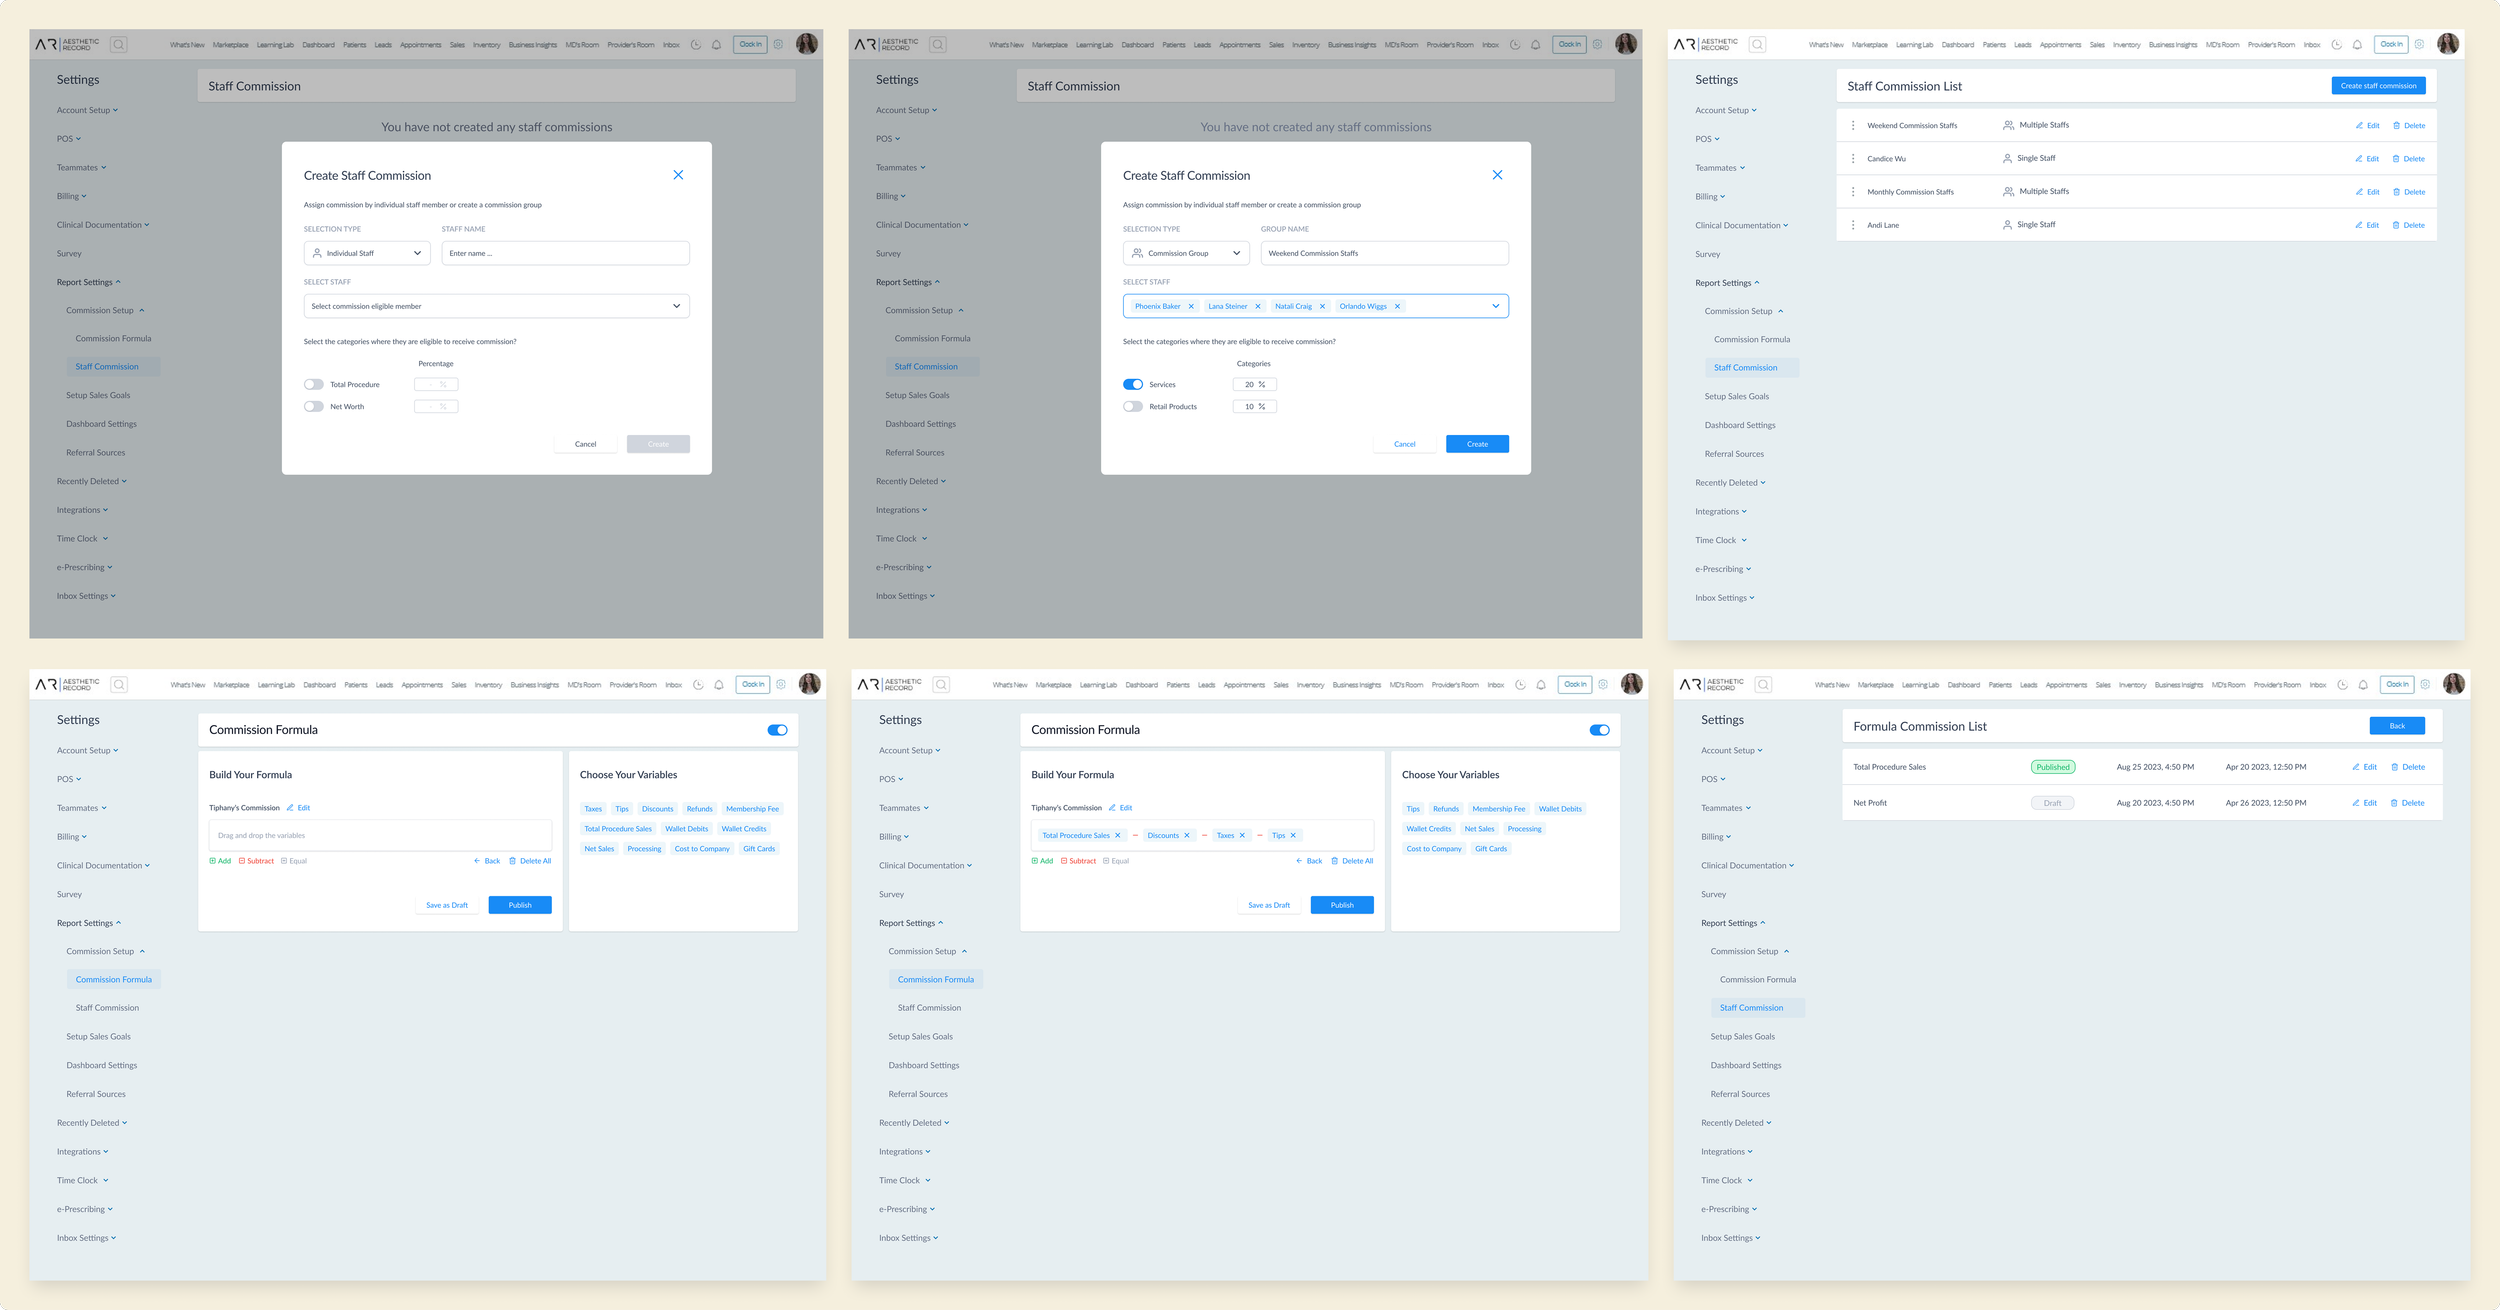
Mid Fidelity & Prototype
Through mid‑fidelity user testing with clinic managers, features were added, removed, and refined while preserving consistency with the existing internal UI system.
FINAL PRODUCT
High Fidelity
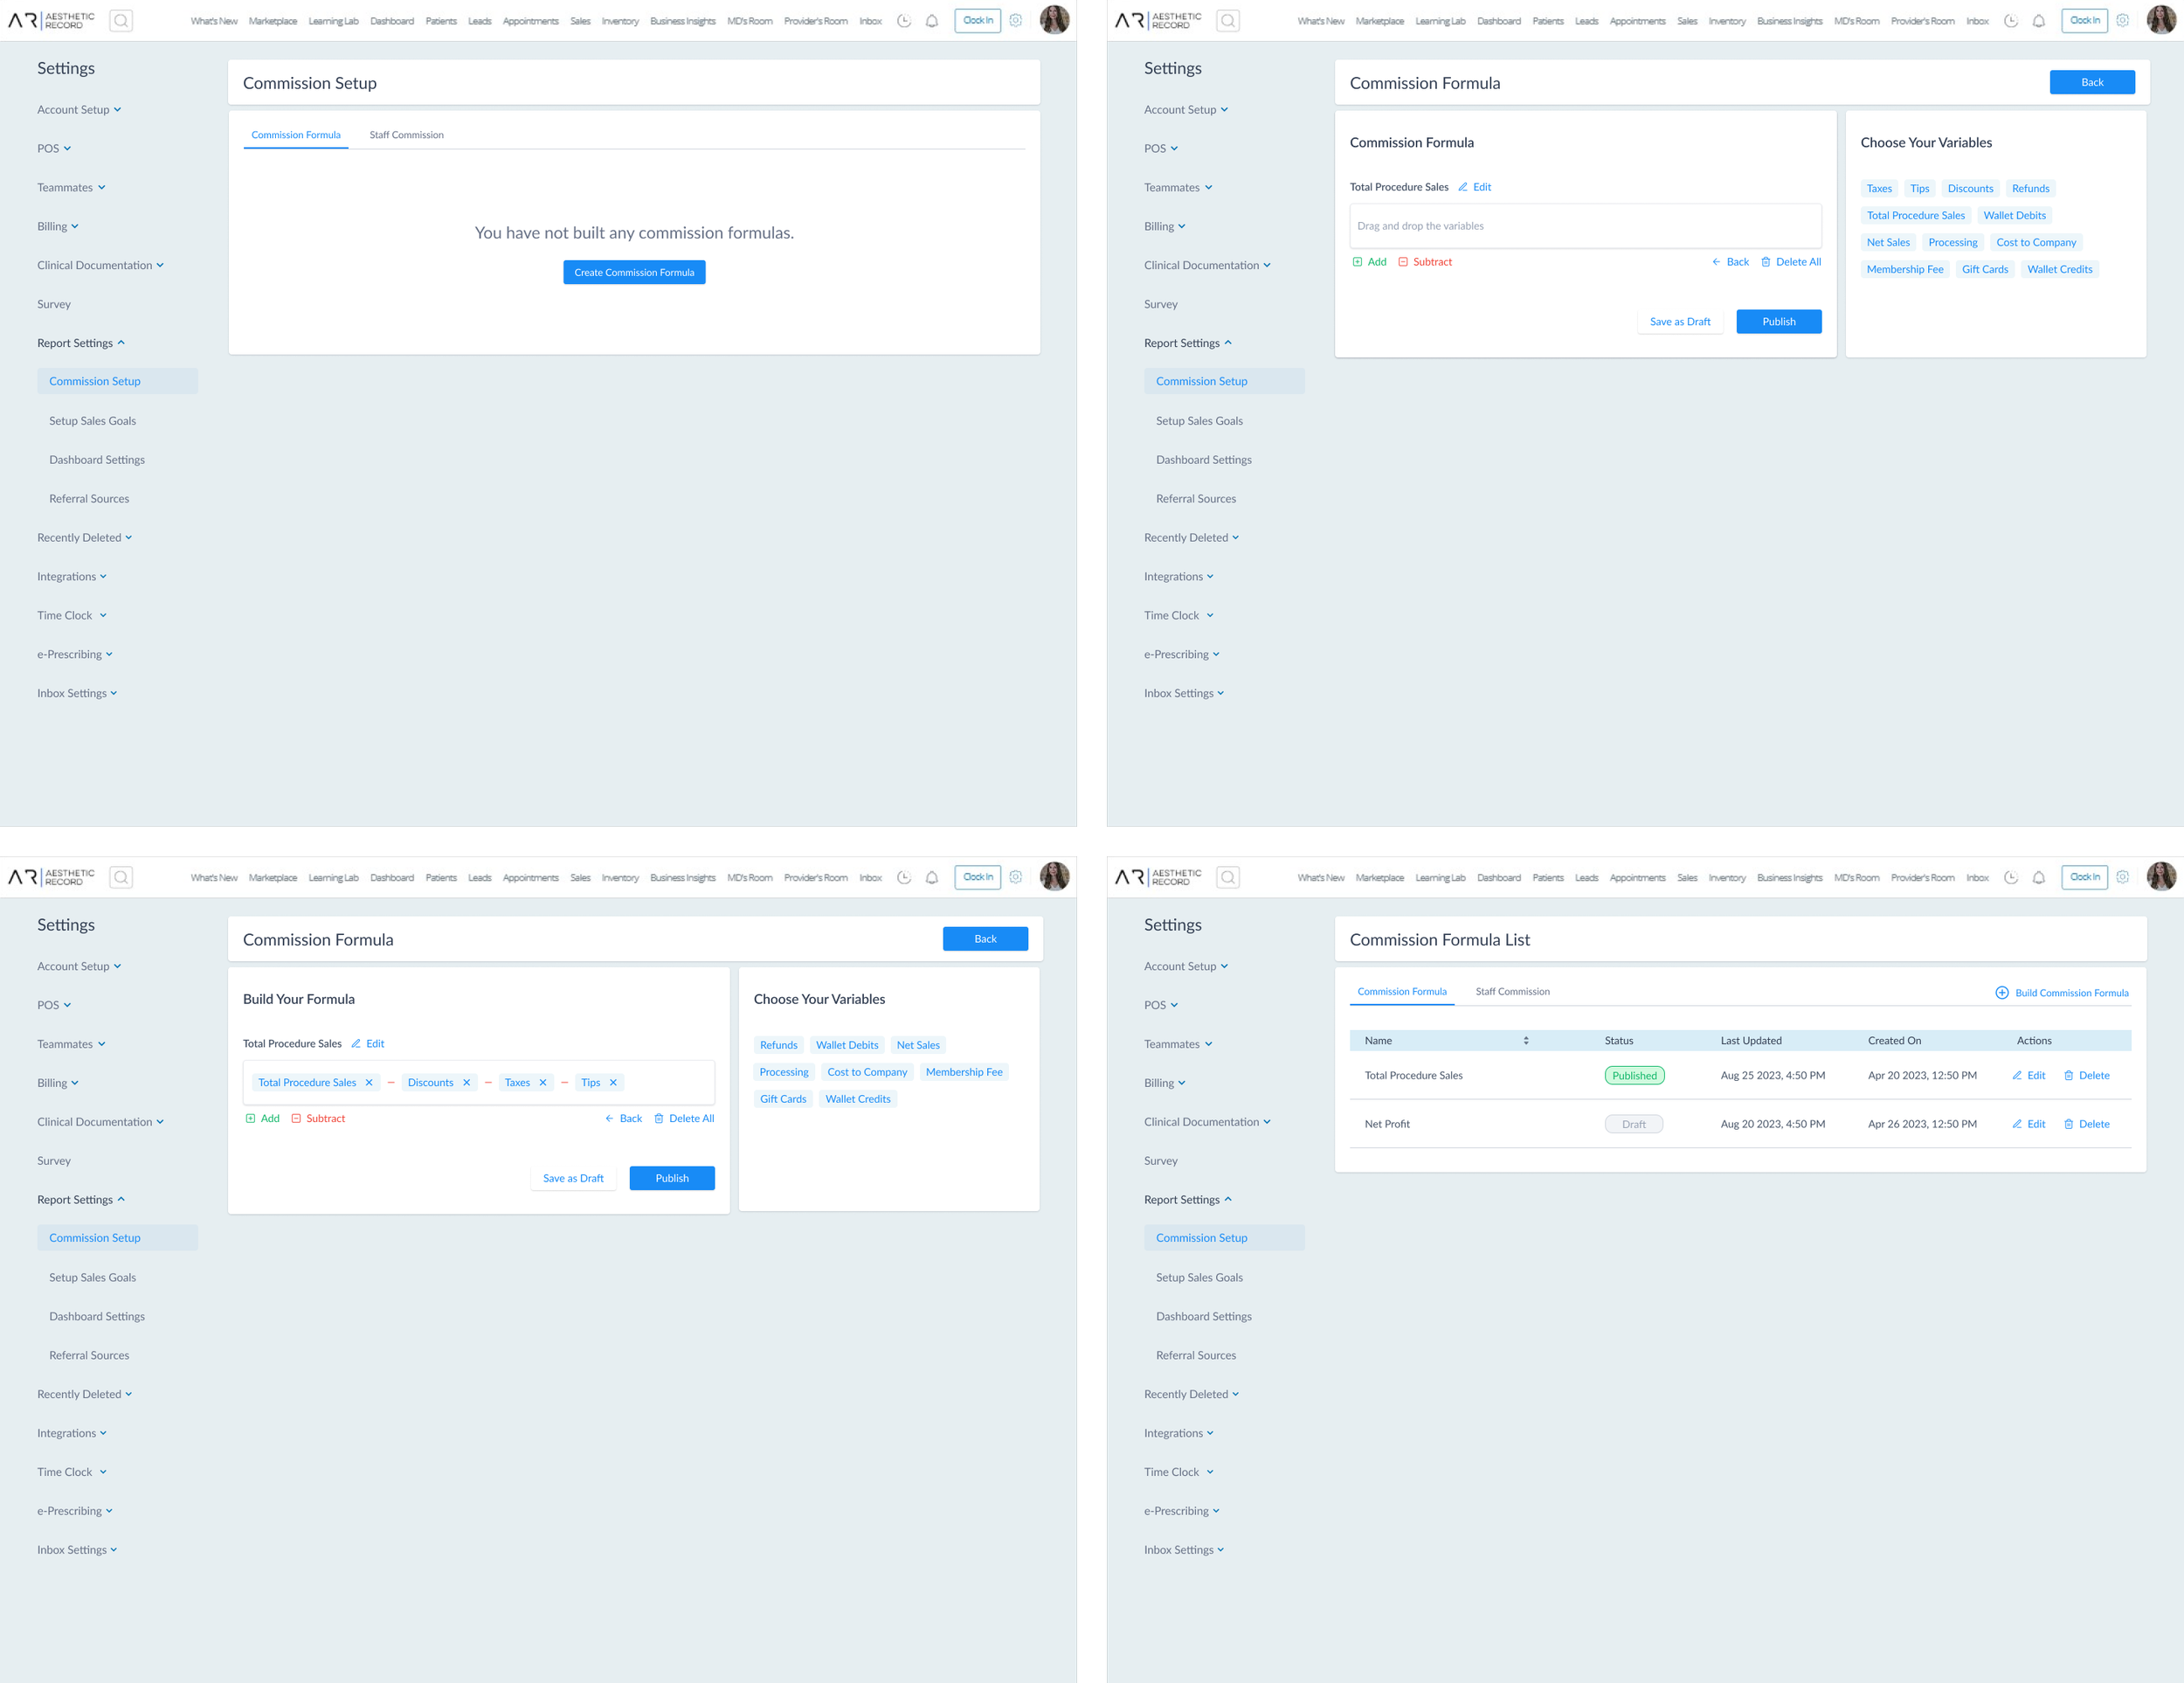
This phase represents the final design direction for future development. We delivered high‑fidelity prototypes that validate the full end‑to‑end commission reporting experience.
1. Commission Formula
The Commission Formula page enables clinic managers to create flexible, performance‑based commission structures by selecting incentive variables, defining custom commission types, and automatically generating a clear list of commissions tracked within the dashboard.
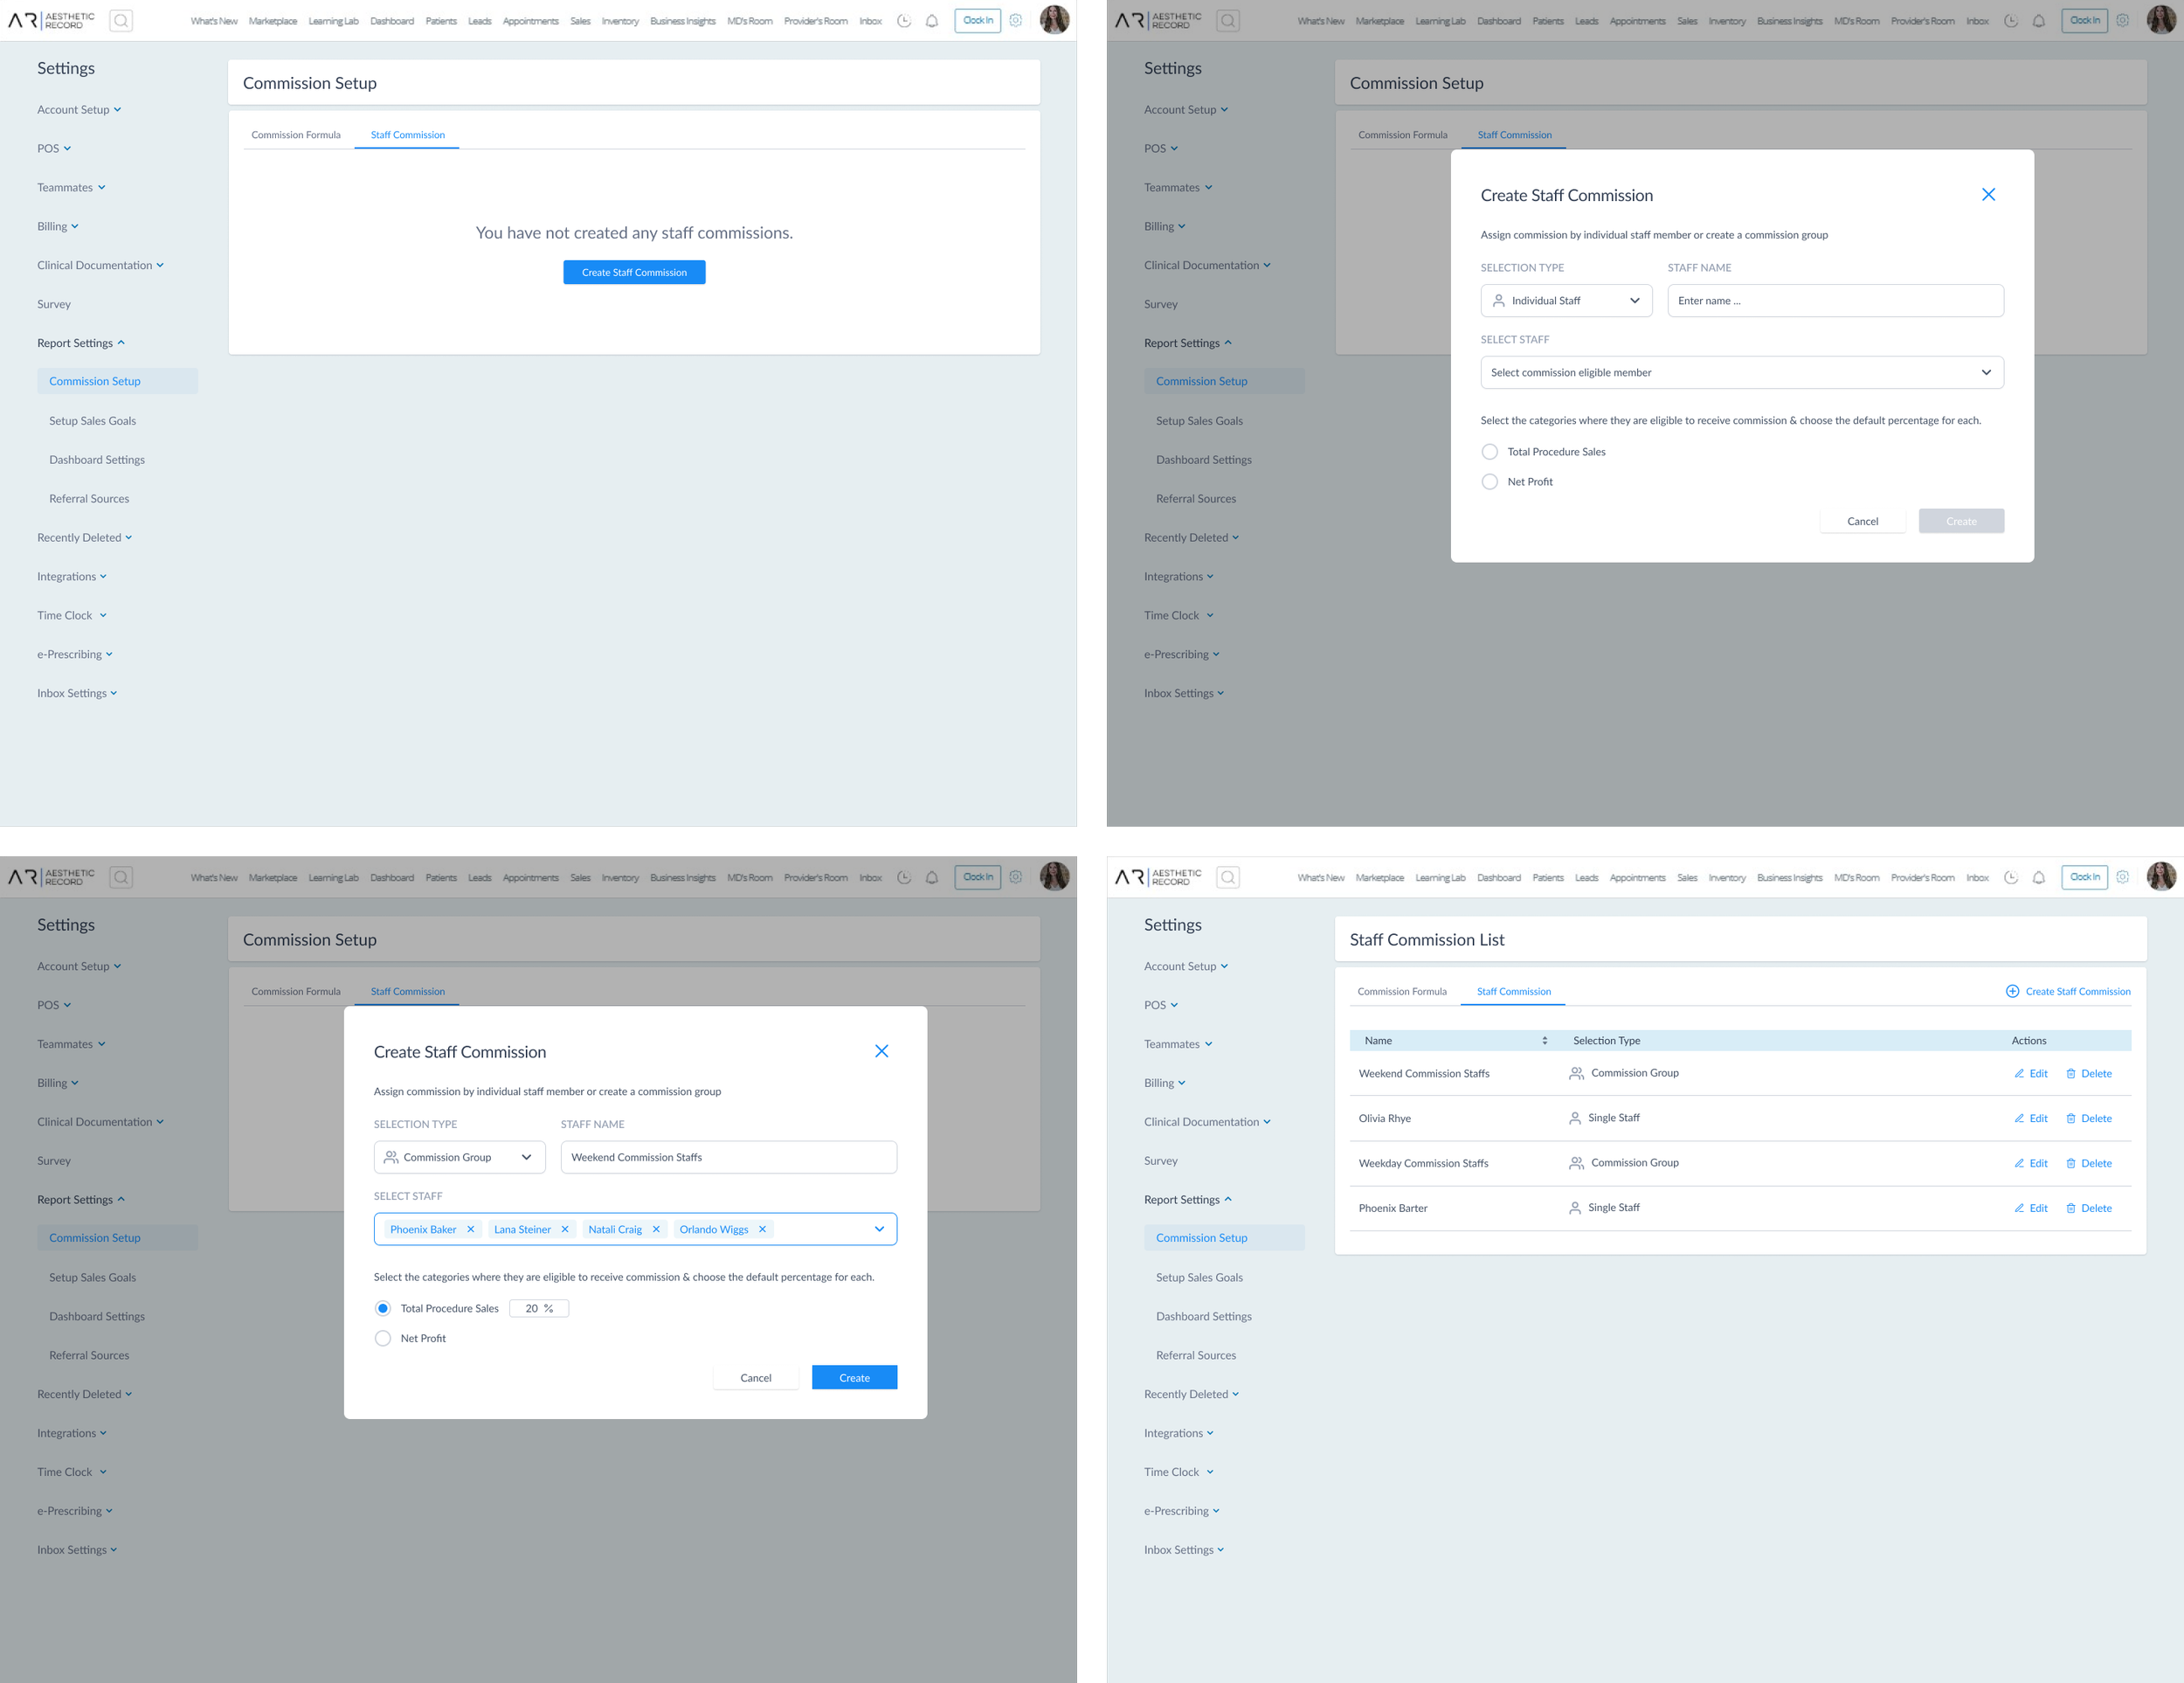
2. Staff Commission
The Staff Commission page allows clinic managers to assign commissions to individual staff members or groups using commission structures created in the Commission Formula page. Managers can apply commission rates (%) and view a clear, centralized dashboard of all staff receiving commissions.
Below is an interactive prototype built in Figma. Feel free to explore the design by clicking the link below. Thank you ⬇
SOLUTION
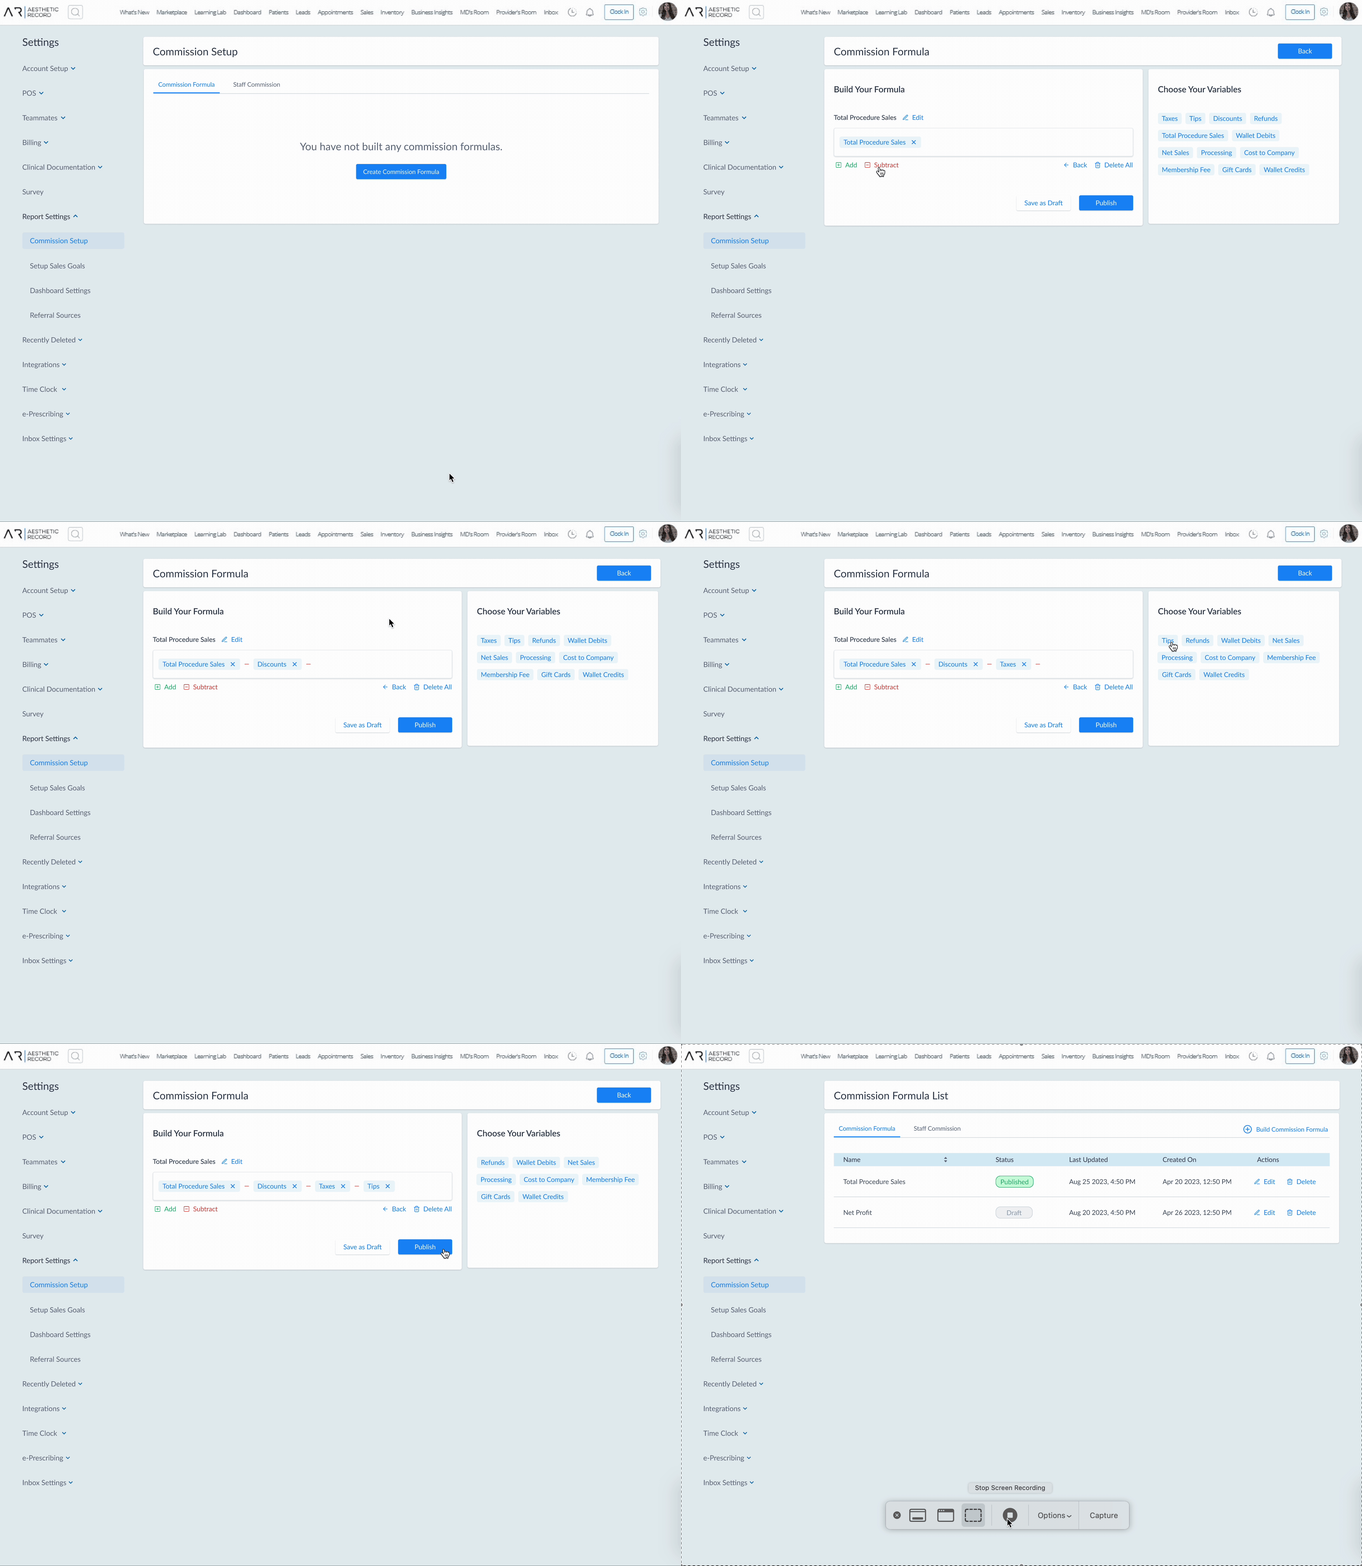
Sales/Service Commission
Select various incentive variables to customize unique commission categories and view a list of commissions created
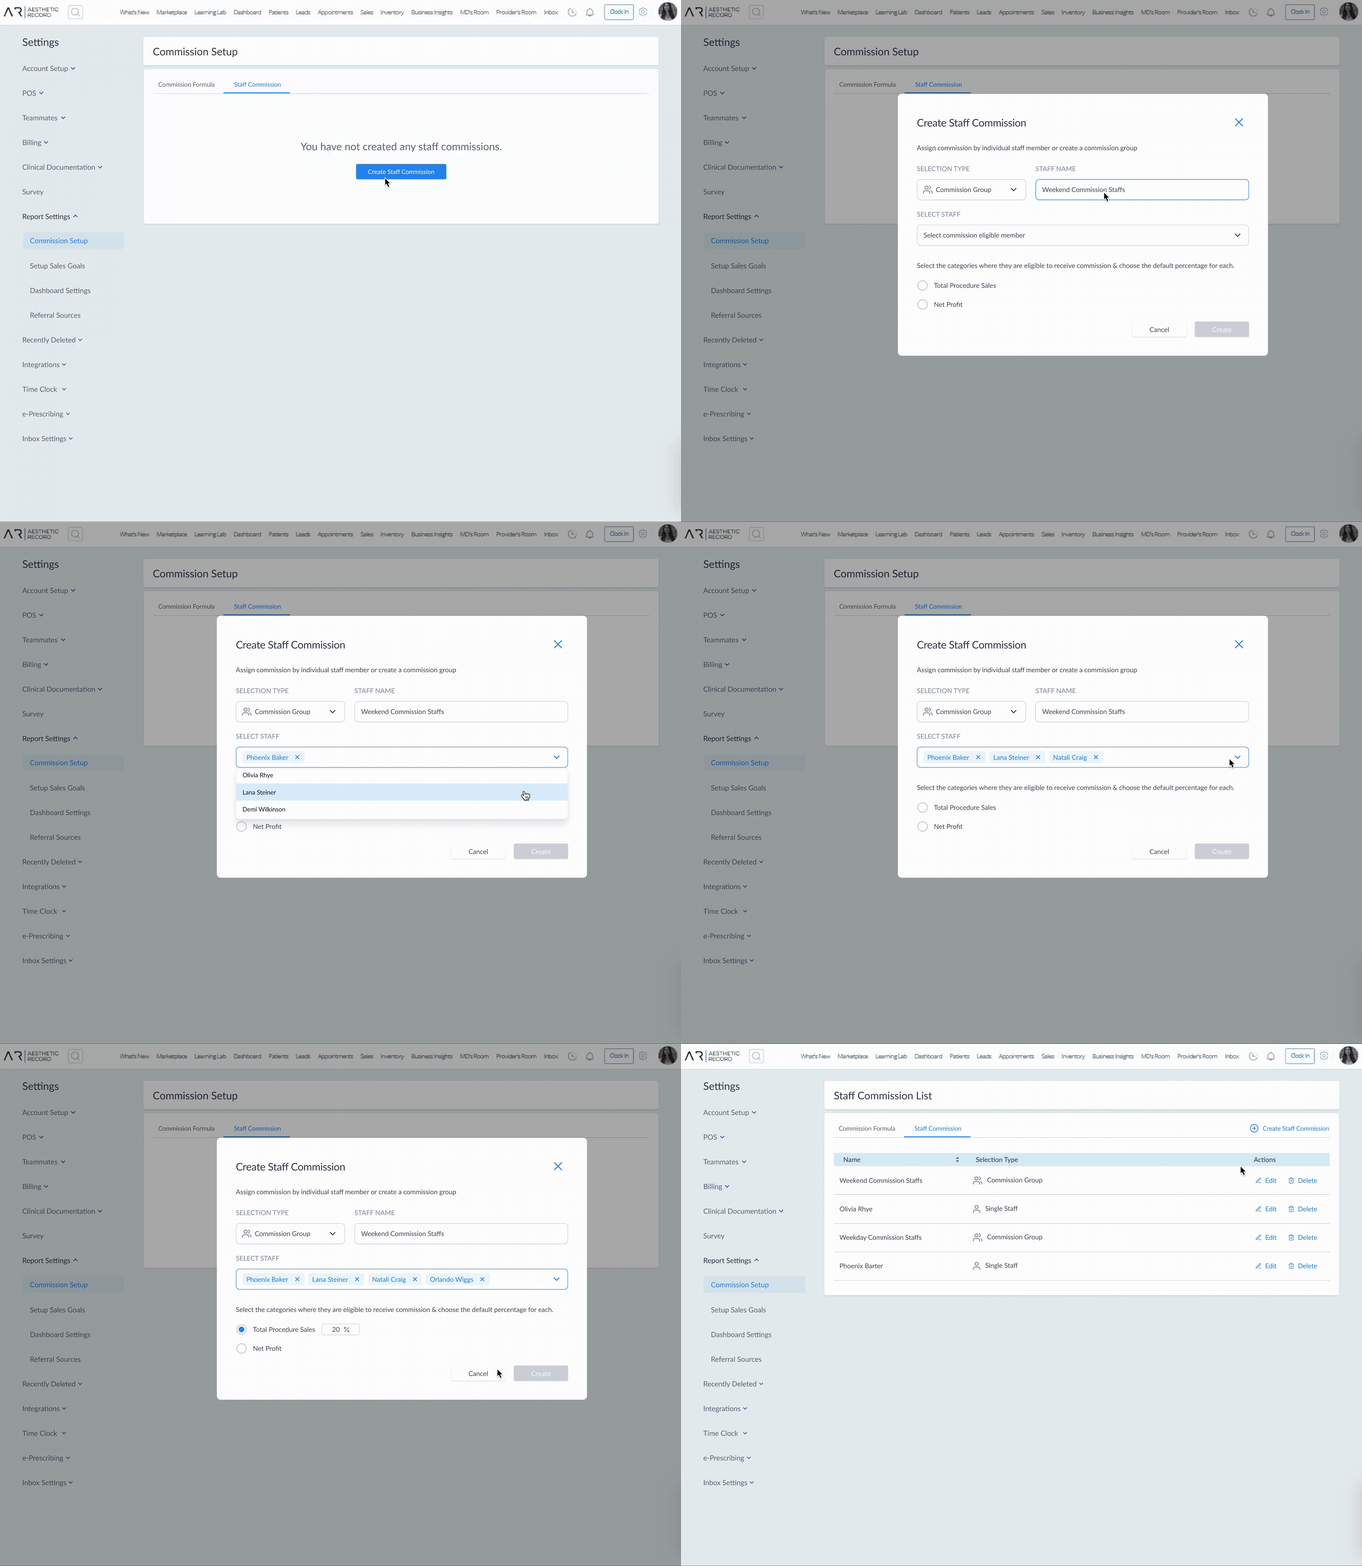
Create Staff Commission
Create staff profiles on an individual staff or in groups to assign different commission categories and view a list of staff
After Thought
Our team had to make certain assumptions during our research phase due to time constraints. Ideally, I wish the team had benefited from additional time earlier on, allowing us to concentrate more on in-depth user research and effectively synthesize the data for crafting the design solution.